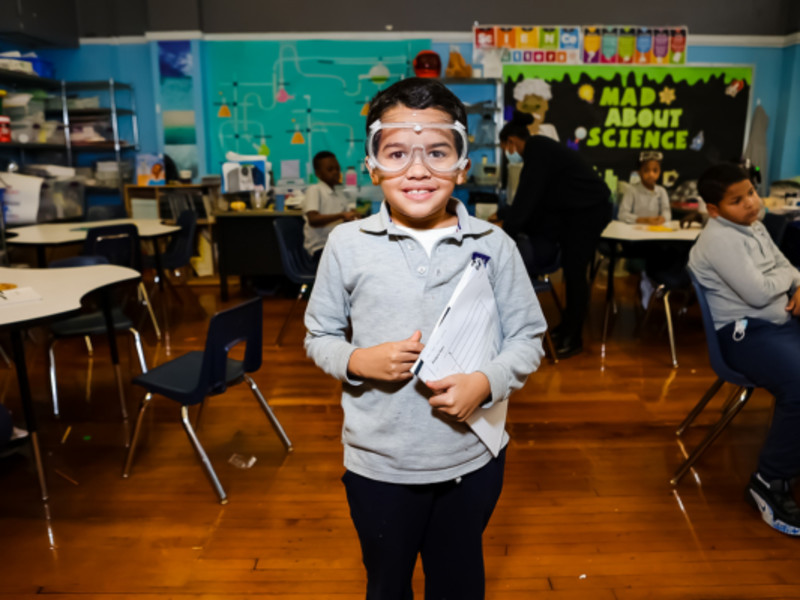
SPONSORED POST: Every Kid Known. Every Family Heard. 100% College Prep.
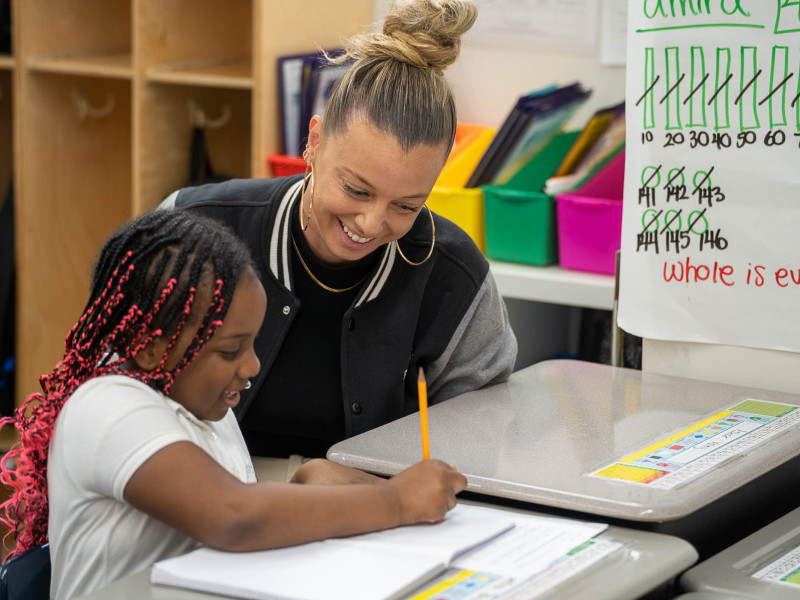
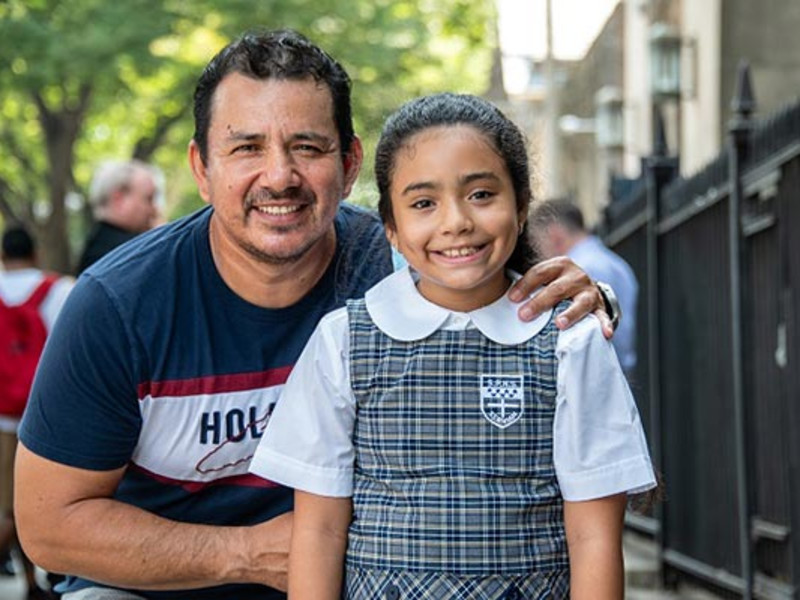
The following is a paid message from Democracy Prep Public Schools. At Democracy Prep, they believe the best learning happens when children feel safe, supported, and free to be kids. In their Harlem and Bronx elementary, middle, and high schools, every student is celebrated for who they are and...